Role
Product Design Lead (IC)
Responsibilities
Inf. Architecture, UI, Research, Design System, App Design, Collaboration
Duration
2+ years
Designing a Cross-Platform Experience for Mapsted’s Indoor Navigation & Analytics System
Designing a Cross-Platform Experience for Mapsted’s Indoor Navigation & Analytics System
My Role
My role focused on shaping that web experience, building tools that transformed raw, granular location data into actionable business insights. The work spanned across the Manage CMS, Notify, and Analytics platforms. As a remote designer, I led UX and UI design for the web ecosystem, driving clarity, usability, and cross-platform cohesion.
Understanding the Business Context
Each team using Mapsted’s platform had different goals. A retail manager wanted to know how long visitors lingered near product displays. A marketer needed to target high-traffic zones with limited-time offers. A transit operator needed to understand congestion points during peak hours. All of them required access to behavioral data, but they didn’t necessarily know how to ask the right questions, let alone make sense of raw location data.
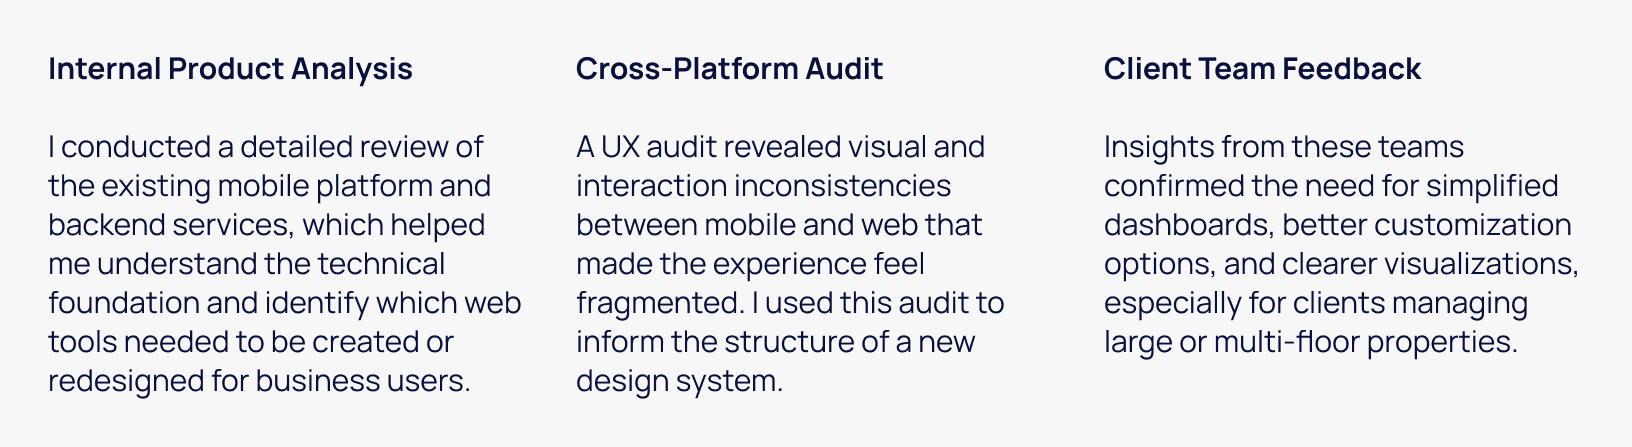
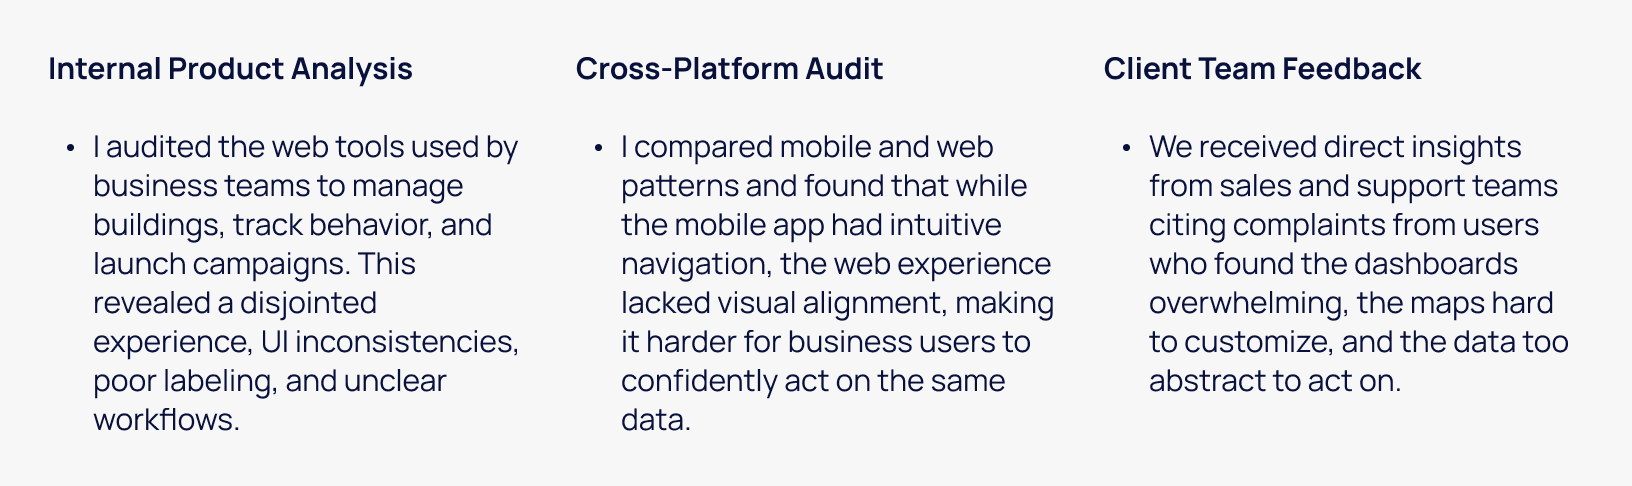
We began by examining how different industries were interacting with Mapsted’s tools. While I didn’t have direct access to users for in-depth interviews, I collaborated closely with the product team to analyze feedback and behavioral data from clients across sectors:
Retail managers aiming to boost footfall in underperforming areas
Airport operators needing predictive crowd flow insights
Corporate admins looking to visualize employee movement patterns
Event organizers managing traffic and safety in dynamic venues
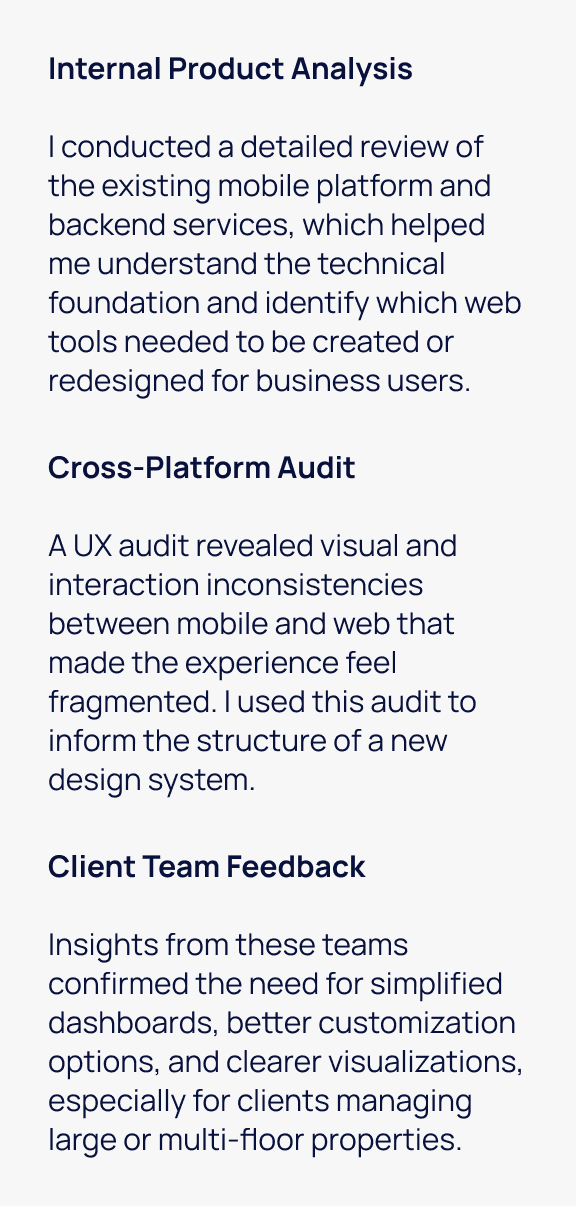
Alongside this, I reviewed internal usability studies from the mobile app and audited user flows across the web dashboard to identify breakpoints, confusing interactions, and missed opportunities.
Manage CMS & Property Configuration
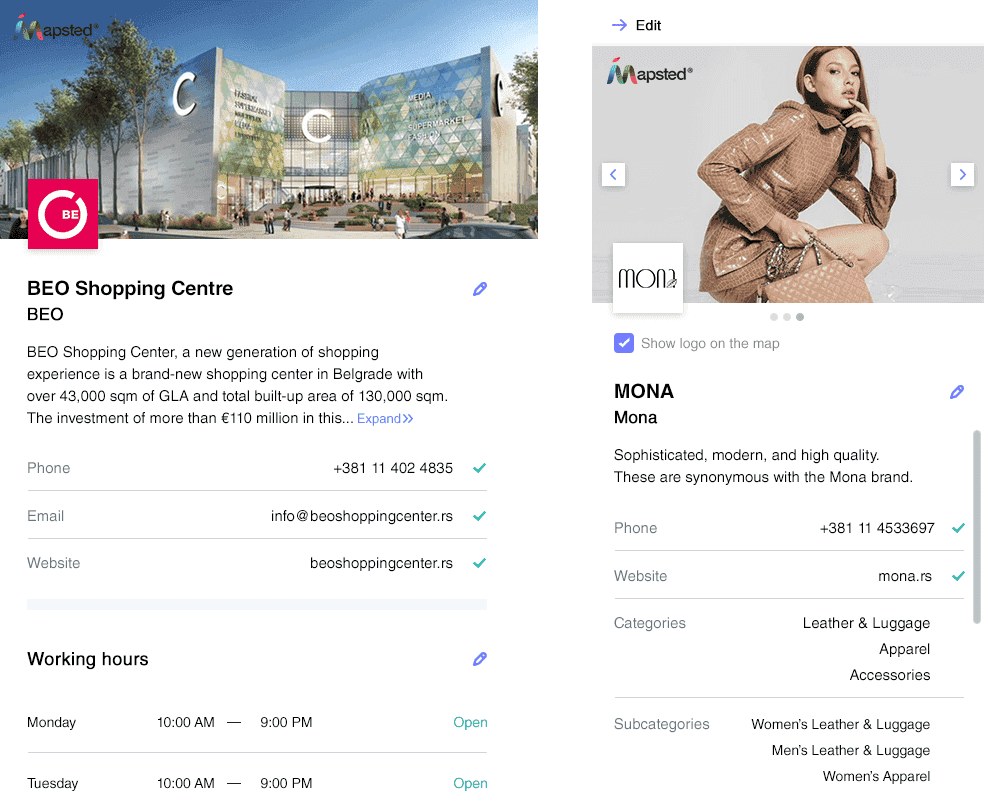
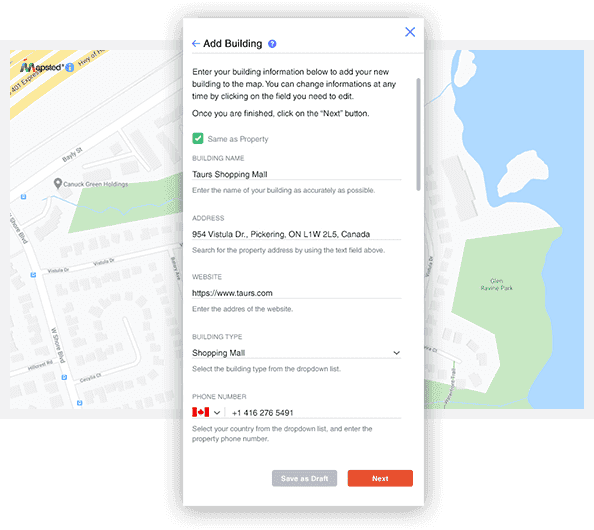
I also redesigned the Manage content management system, where users could upload floor plans, define zones, set business hours, and configure map logic.
The original experience was fragmented and technical. I turned it into a guided workflow, with validations and previews at every step:
Upload floor plan
Define points of interest
Tag accessibility attributes
Preview routing logic and user paths
To accommodate various industries, I included support for:
Multi-level buildings
Holiday schedules
Custom POI categories
Branded visual themes
Ongoing Research Methods
Designing from Scratch: Notify & Analytics
When I began work on Notify and Analytics, there were no prior designs, no live user behavior to analyze, and no visual interface, only product specs and backend logic. These tools were still being defined, so my work focused on translating abstract technical capabilities into intuitive, human-centered tools.
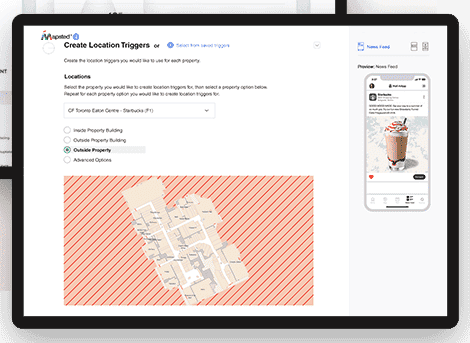
Notify: Campaign Builder for Location-Aware Messaging
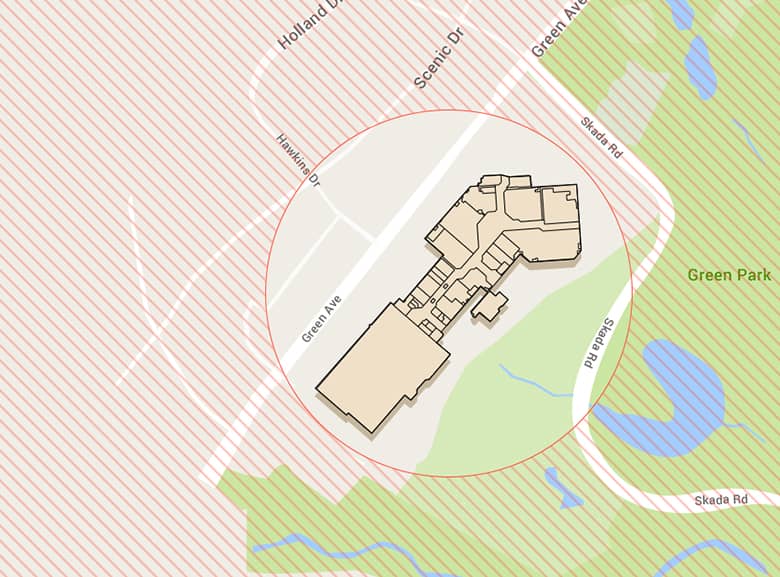
Notify was envisioned as a location-triggered messaging platform where businesses could create campaigns based on user behavior and geofencing logic. I designed the first version of this product from scratch.
I introduced a modular “rule builder” that allowed marketers to define conditions like:
“If a user enters Zone B and remains for more than 5 minutes, then send Offer A.”
Map previews helped validate target zones visually.
Step-by-step logic flows and contextual help made the system approachable for non-technical users.
Even without live data, I designed Notify to be scalable and adaptable, ensuring it could support everything from simple alerts to sophisticated automation.
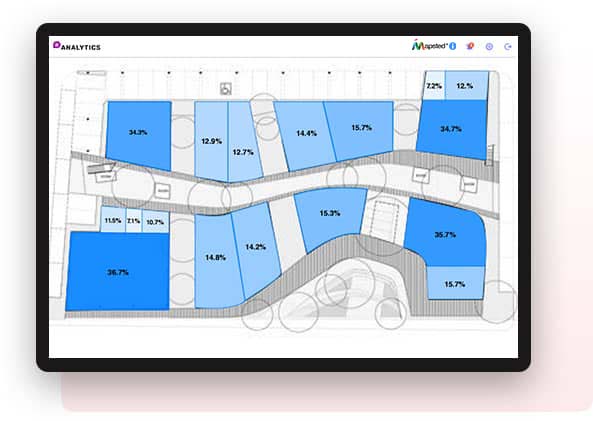
Analytics: Turning Movement into Meaning
Analytics was Mapsted’s behavioral intelligence layer. The product team had built robust backend tracking, but no frontend to expose that value to end users. My challenge was to imagine and structure the way users would consume movement data, from foot traffic to dwell time.
I designed flexible dashboards that surfaced key metrics like: heatmaps, trajectory replays, entry/exit data, average dwell time
Users could toggle time periods, layer different zones, and filter by behavior
All visualization components were custom-built and optimized for clarity and scan-ability
These initial designs later served as the foundation for deeper feature iterations once clients began using the tools in production.
Manage CMS & Property Configuration
I also redesigned the Manage content management system, where users could upload floor plans, define zones, set business hours, and configure map logic.
The original experience was fragmented and technical. I turned it into a guided workflow, with validations and previews at every step:
Upload floor plan
Define points of interest
Tag accessibility attributes
Preview routing logic and user paths
To accommodate various industries, I included support for:
Multi-level buildings
Holiday schedules
Custom POI categories
Branded visual themes
Creating a Design System with Adobe XD
The web and mobile products had diverged visually, leading to inconsistent behavior and visual confusion. I conducted a full audit and built a custom design system from scratch in Adobe XD.
Defined consistent rules for spacing, typography, and grid layout
Manually built reusable components for navigation, cards, modals, data visuals, and tables
Documented states and interactions for handoff
This system significantly improved delivery speed and helped onboard new team members faster.
-> Unfortunately, I no longer have access to the design system files since Adobe XD was accessed through the company’s email account.
Designing for Global Reach & Accessibility
As Mapsted expanded internationally, localization became critical. I implemented support for:
Automatic language detection and multi-language UIs
Customizable color schemes and branding overlays for business clients
Voice navigation integration and custom route preferences (avoid stairs/escalators) to support users with disabilities
Accessibility wasn’t a nice-to-have, it was a core driver of user adoption across industries like healthcare and education.
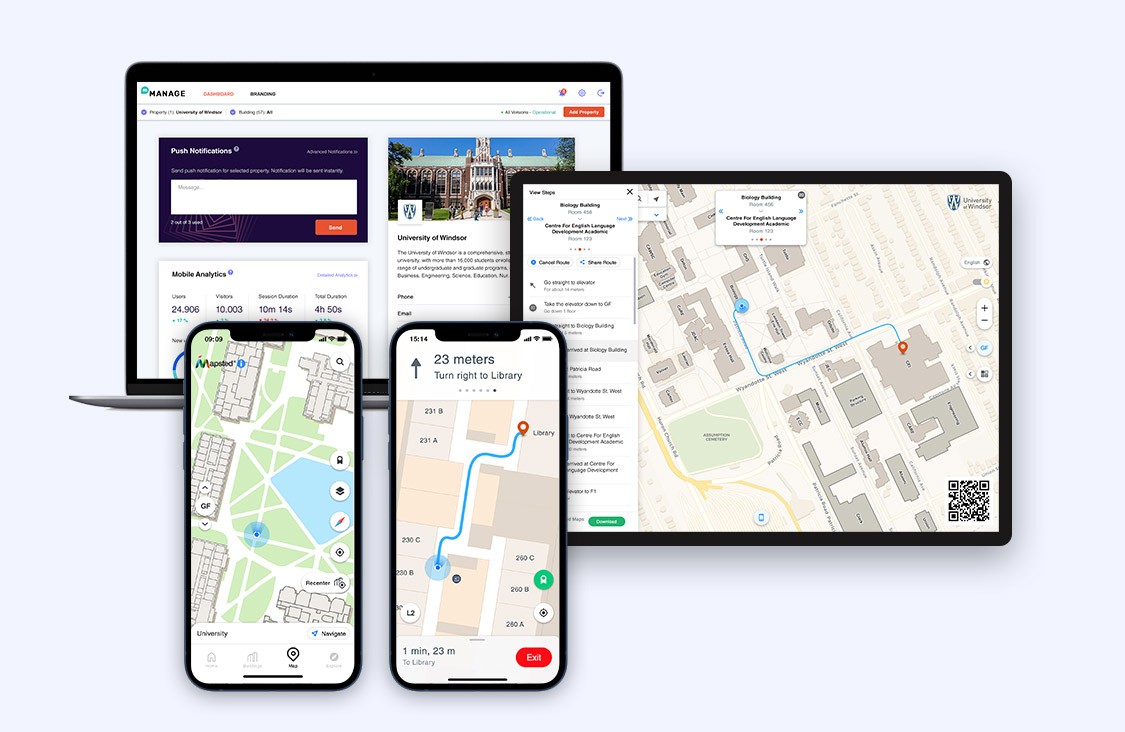
Cross-Platform Consistency
It was crucial to ensure that the web dashboard reflected the same data and logic as the mobile app. I collaborated with developers to maintain a unified experience:
Intelligent Search: Optimized for each platform, on mobile it helped users find places; on web, it let admins find data, zones, or user segments
Offline Support: Enabled critical access even without live connectivity
Real-Time Sync: Data from mobile wayfinding (like heatmaps and movement trails) was reflected in real-time on the web dashboard for live analysis
The result was a cohesive system where what users experienced on the ground aligned with what business teams saw in the control panel.
Results & Measurable Impact
Even though some tools were launched in early versions without live usage history, we quickly saw outcomes once they were deployed:
30% increase in navigation completion on mobile due to better real-time routing and clarity
15% drop in airport complaints, attributed to improved dashboard-triggered alerts and gate messaging
20% improvement in asset tracking, thanks to more intuitive web UI and real-time zone overlays
40% increase in dashboard engagement, with business users spending more time exploring heatmaps and behavior flows for smarter decisions
Key Learnings
Foundational design is strategic: Designing the first version of a product comes with unique responsibility. You’re setting patterns, assumptions, and interactions that will scale, so they need to be strong, clear, and flexible from day one.
Accessibility is a growth lever: The decision to include voice routes, localization, and custom route options wasn’t just inclusive, it helped the product expand globally and serve more verticals.
Unifying web + mobile strengthens both: Creating one continuous loop between user activity (mobile) and business decision-making (web) turned Mapsted from a navigation app into a spatial intelligence platform.
My Role
My role focused on shaping that web experience, building tools that transformed raw, granular location data into actionable business insights. The work spanned across the Manage CMS, Notify, and Analytics platforms. As a remote designer, I led UX and UI design for the web ecosystem, driving clarity, usability, and cross-platform cohesion..
My Role
My role focused on shaping that web experience, building tools that transformed raw, granular location data into actionable business insights. The work spanned across the Manage CMS, Notify, and Analytics platforms. As a remote designer, I led UX and UI design for the web ecosystem, driving clarity, usability, and cross-platform cohesion.
Research & Insights
Each team using Mapsted’s platform had different goals. A retail manager wanted to know how long visitors lingered near product displays. A marketer needed to target high-traffic zones with limited-time offers. A transit operator needed to understand congestion points during peak hours. All of them required access to behavioral data, but they didn’t necessarily know how to ask the right questions, let alone make sense of raw location data.
We began by examining how different industries were interacting with Mapsted’s tools. While I didn’t have direct access to users for in-depth interviews, I collaborated closely with the product team to analyze feedback and behavioral data from clients across sectors:
Retail managers aiming to boost footfall in underperforming areas
Airport operators needing predictive crowd flow insights
Corporate admins looking to visualize employee movement patterns
Event organizers managing traffic and safety in dynamic venues
Alongside this, I reviewed internal usability studies from the mobile app and audited user flows across the web dashboard to identify breakpoints, confusing interactions, and missed opportunities.
Research & Insights
the Business Context
Each team using Mapsted’s platform had different goals. A retail manager wanted to know how long visitors lingered near product displays. A marketer needed to target high-traffic zones with limited-time offers. A transit operator needed to understand congestion points during peak hours. All of them required access to behavioral data, but they didn’t necessarily know how to ask the right questions, let alone make sense of raw location data.
We began by examining how different industries were interacting with Mapsted’s tools. While I didn’t have direct access to users for in-depth interviews, I collaborated closely with the product team to analyze feedback and behavioral data from clients across sectors:
Retail managers aiming to boost footfall in underperforming areas
Airport operators needing predictive crowd flow insights
Corporate admins looking to visualize employee movement patterns
Event organizers managing traffic and safety in dynamic venues
Alongside this, I reviewed internal usability studies from the mobile app and audited user flows across the web dashboard to identify breakpoints, confusing interactions, and missed opportunities.
Ongoing Research Methods
Creating a Design System with Adobe XD
The web and mobile products had diverged visually, leading to inconsistent behavior and visual confusion. I conducted a full audit and built a custom design system from scratch in Adobe XD.
Defined consistent rules for spacing, typography, and grid layout
Manually built reusable components for navigation, cards, modals, data visuals, and tables
Documented states and interactions for handoff
This system significantly improved delivery speed and helped onboard new team members faster.
-> Unfortunately, I no longer have access to the design system files since Adobe XD was accessed through the company’s email account.
-> Unfortunately, I no longer have access to the design system files since Adobe XD was accessed through the company’s email account.
-> Unfortunately, I no longer have access to the design system files since Adobe XD was accessed through the company’s email account.
-> Unfortunately, I no longer have access to the design system files since Adobe XD was accessed through the company’s email account.
Designing for Global Reach & Accessibility
As Mapsted expanded internationally, localization became critical. I implemented support for:
Automatic language detection and multi-language UIs
Customizable color schemes and branding overlays for business clients
Voice navigation integration and custom route preferences (avoid stairs/escalators) to support users with disabilities
Accessibility wasn’t a nice-to-have, it was a core driver of user adoption across industries like healthcare and education.
Cross-Platform Consistency
It was crucial to ensure that the web dashboard reflected the same data and logic as the mobile app. I collaborated with developers to maintain a unified experience:
Intelligent Search: Optimized for each platform, on mobile it helped users find places; on web, it let admins find data, zones, or user segments
Offline Support: Enabled critical access even without live connectivity
Real-Time Sync: Data from mobile wayfinding (like heatmaps and movement trails) was reflected in real-time on the web dashboard for live analysis
The result was a cohesive system where what users experienced on the ground aligned with what business teams saw in the control panel.
Results & Measurable Impact
Even though some tools were launched in early versions without live usage history, we quickly saw outcomes once they were deployed:
30% increase in navigation completion on mobile due to better real-time routing and clarity
15% drop in airport complaints, attributed to improved dashboard-triggered alerts and gate messaging
20% improvement in asset tracking, thanks to more intuitive web UI and real-time zone overlays
40% increase in dashboard engagement, with business users spending more time exploring heatmaps and behavior flows for smarter decisions
Key Learnings
Foundational design is strategic: Designing the first version of a product comes with unique responsibility. You’re setting patterns, assumptions, and interactions that will scale, so they need to be strong, clear, and flexible from day one.
Accessibility is a growth lever: The decision to include voice routes, localization, and custom route options wasn’t just inclusive—it helped the product expand globally and serve more verticals.
Unifying web + mobile strengthens both: Creating one continuous loop between user activity (mobile) and business decision-making (web) turned Mapsted from a navigation app into a spatial intelligence platform.
Key Learnings
Foundational design is strategic: Designing the first version of a product comes with unique responsibility. You’re setting patterns, assumptions, and interactions that will scale, so they need to be strong, clear, and flexible from day one.
Accessibility is a growth lever: The decision to include voice routes, localization, and custom route options wasn’t just inclusive, it helped the product expand globally and serve more verticals.
Unifying web + mobile strengthens both: Creating one continuous loop between user activity (mobile) and business decision-making (web) turned Mapsted from a navigation app into a spatial intelligence platform.
Cross-Platform Consistency
It was crucial to ensure that the web dashboard reflected the same data and logic as the mobile app. I collaborated with developers to maintain a unified experience:
Intelligent Search: Optimized for each platform, on mobile it helped users find places; on web, it let admins find data, zones, or user segments
Offline Support: Enabled critical access even without live connectivity
Real-Time Sync: Data from mobile wayfinding (like heatmaps and movement trails) was reflected in real-time on the web dashboard for live analysis
The result was a cohesive system where what users experienced on the ground aligned with what business teams saw in the control panel.
Designing for Global Reach & Accessibility
As Mapsted expanded internationally, localization became critical. I implemented support for:
Automatic language detection and multi-language UIs
Customizable color schemes and branding overlays for business clients
Voice navigation integration and custom route preferences (avoid stairs/escalators) to support users with disabilities
Accessibility wasn’t a nice-to-have, it was a core driver of user adoption across industries like healthcare and education.
Manage CMS & Property Configuration
I also redesigned the Manage content management system, where users could upload floor plans, define zones, set business hours, and configure map logic.
The original experience was fragmented and technical. I turned it into a guided workflow, with validations and previews at every step:
Upload floor plan
Define points of interest
Tag accessibility attributes
Preview routing logic and user paths
To accommodate various industries, I included support for:
Multi-level buildings
Holiday schedules
Custom POI categories
Branded visual themes